

Part 1 of this article is from my S4x24 Keynote: Believe!. Part 2 is the suggested related metrics for the US and other governments.
Are some of you having trouble with Total Recordable Incident Rate? Or the SEC material incident rate? Or these outage pie charts. I am. They’re important measures of success, and they are lagging indicators. The bad event has already happened. While we should track incidents and their impact, it’s not enough.
The safety industry recognized this after the BP Texas City explosion that killed 15, injured 180 and cost $300M in current dollars. The Baker Panel Report on the Texas City tragedy stated:
The passing of time without a process accident is not necessarily an indication that all is well and may contribute to a dangerous and growing sense of complacency.
This incident and report led to metrics that are leading indicators, predictive of process safety accidents such as API Recommended Practice 754 for the refinery and petrochemical sectors.
Practice 754 identified four tiers of safety performance indicators. Tier 1 is a major consequence event, a loss of process material containment and someone was injured or killed. It’s a lagging indicator, the very bad event has happened.
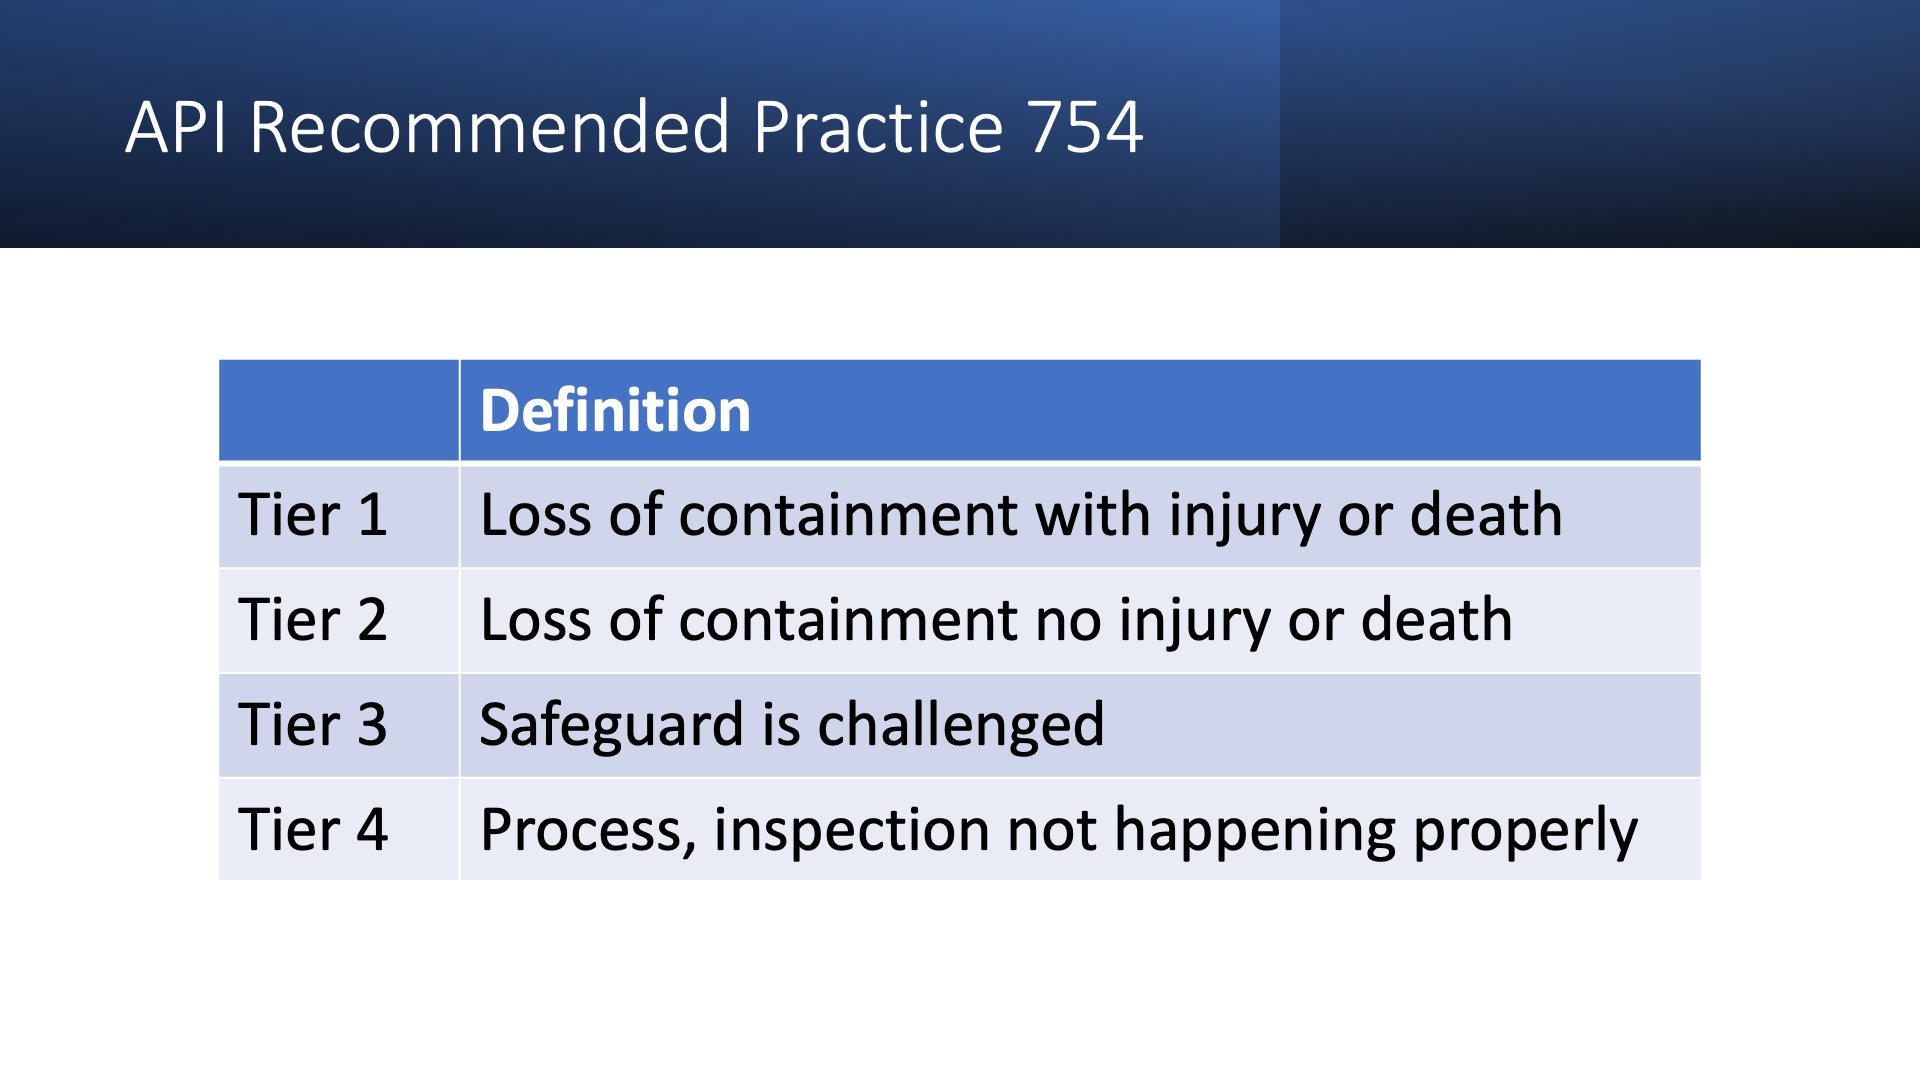
Tiers 2 through 4 are leading indicators. Tier 2 is a loss of containment with no personnel safety consequence. If a gas detector goes off but no one is injured, that’s a tier 2 incident. Tier 3 is when a safeguard is challenged. For instance, a relief valve lifting is a tier 3 event. Tier 4 is a process, inspection or drill not happening properly.
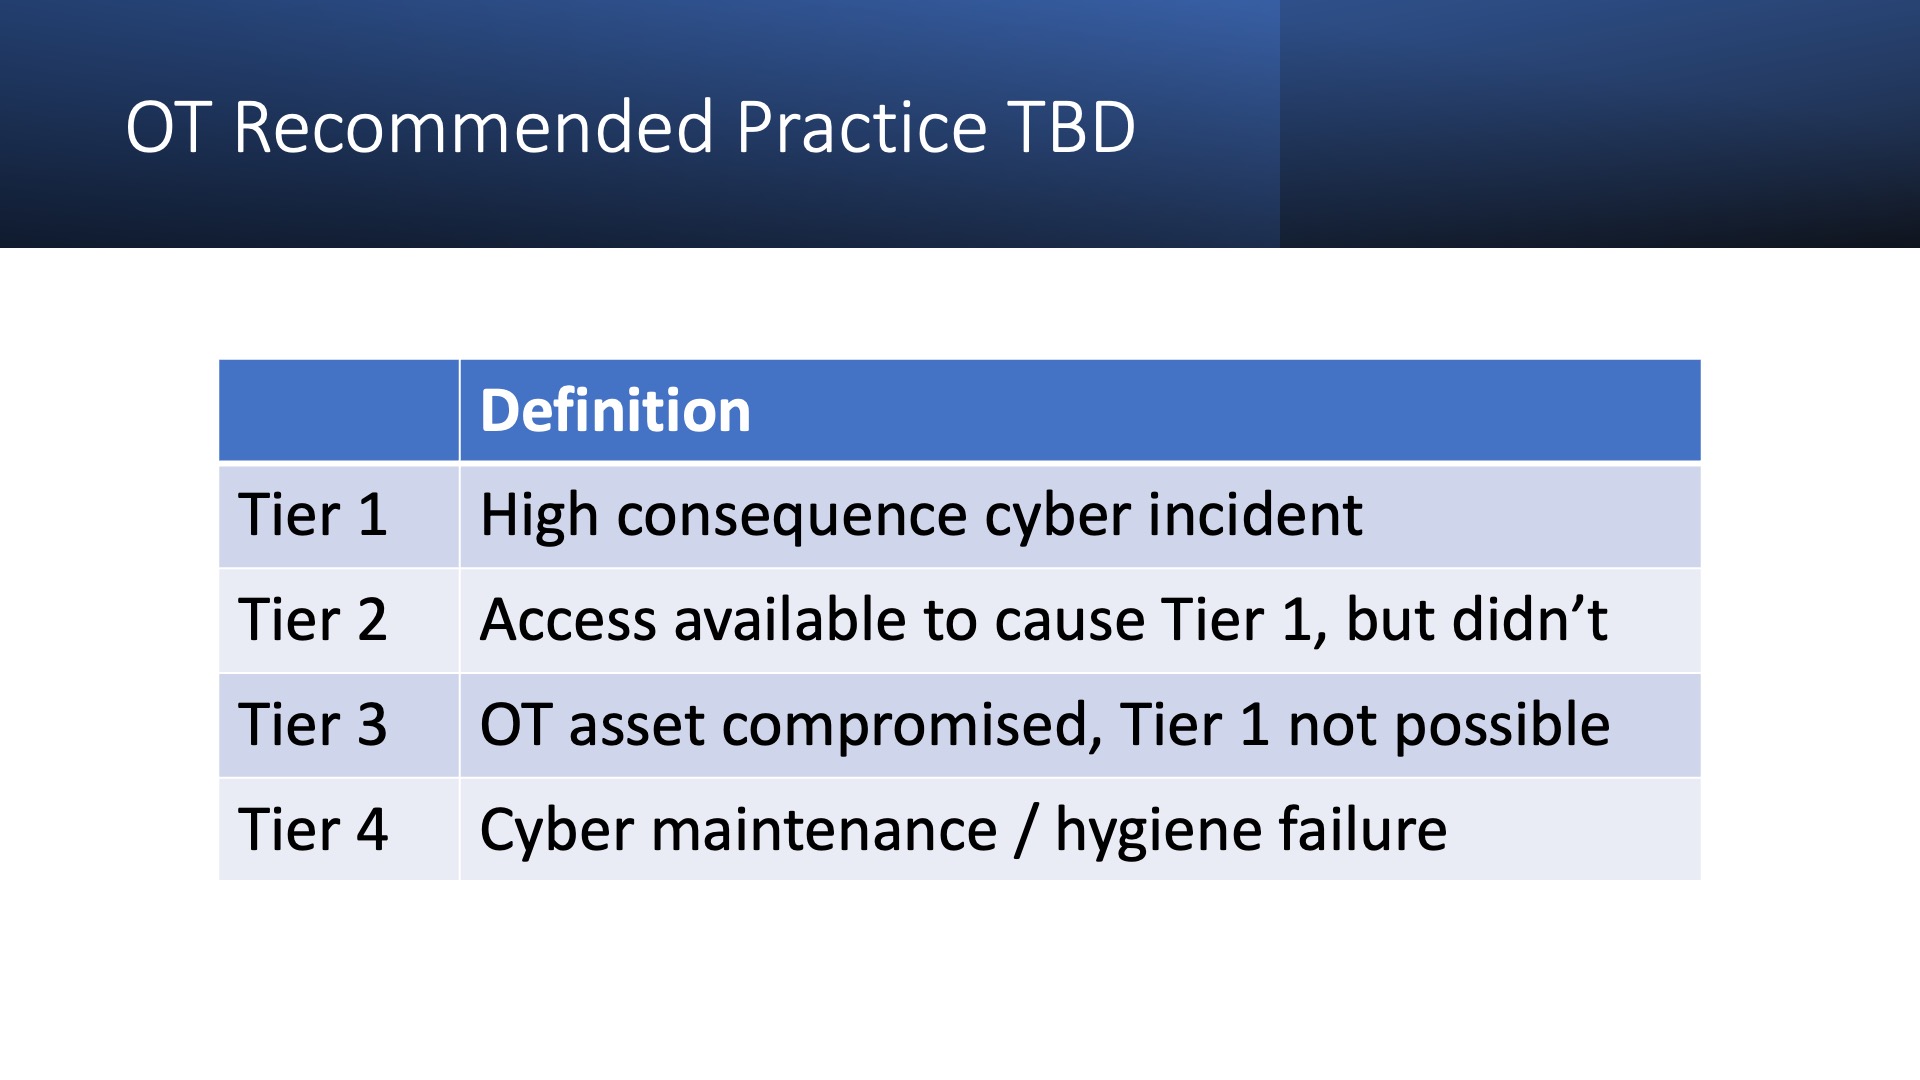
It’s not difficult to come up with an OT security version of this. Tier 1 would be an unacceptable outage, loss of life, or costly equipment damage. Tier 2 could be where an attacker has access that could cause a Tier 1 event, but didn’t. Tier 3 could be unauthorized access that affected OT cyber assets but couldn’t cause a Tier 1 event. I’d bet that Aliquippa, Oldsmar (if you believe it was a hack), and a lot of the other incidents that generate screaming headlines would be Tier 3 events. Tier 4 would be failed cyber maintenance or hygiene.
Recommended Practice 754 is worth a look. It introduces severity weightings for Tier 1 events, and it wouldn’t be hard to develop a weighted metric that combined Tiers 2 – 4 leading indicators into a single score.
Here’s the key thing. The cause for celebration. I know many asset owners who go years without a single Tier 1, 2 or 3 OT security event at a site. This is success.
Metrics For Governments
The easy metric is the number and consequence of Tier 1 events. In the US we have two primary sources.
- Mandatory disclosure to SEC of cyber incidents with a material impact on OT and/or operations. This disclosure requirement for US public companies went into effect in November of 2023. The best compilation of data I’ve seen is the FAIR Institute’s How Material Is That Hack page. Q1 2024 was zero incidents, zero cost. Q2 2024 to date is one material cyber incident that impacted OT or operations, Henry Shein ($105M).
- CIRCIA requirements for covered entities to report substantial cyber incidents. From the proposed rule: “seriously impacts the safety or resiliency of an entity’s operational technology (OT) systems or processes”. The downside is this requirement is scheduled to go into effect in 2026.
The data for Tier 2 and Tier 3 events, the leading indicators, is harder to find. Right now the ICSSTRIVE / Waterfall Security Solutions report is the best we have. The US incidents from the 68 global incidents in 2023 could be assigned to the appropriate Tier. The US Government certainly has more resources and data points to do a more thorough job of collecting and adding to open source information.
While we should use the data we have, we also should be looking for ways to force collection of additional data. Industry groups can ask for this anonymously. Regulators can require this disclosure.
A growing number of Tier 2 incidents would be a key leading indicator. A growing number of Tier 3 incidents is both a positive and negative. Positive in that a successful compromise could not cause a Tier 1 event. Negative in that we are seeing more compromises and there is some chance putting this in Tier 3 could be incorrect.
Summary Metrics To Date
API 754 Like Metrics
- The number and cost of Tier 1 events in the country, quarterly and annually, collected from SEC Disclosures and CIRCIA reporting.
- The number and cost of Tier 2 and Tier 3 events in the country, quarterly and annually, as collected from open source information, interview, and regulatory reporting.
Footnotes
- A government would be well served breaking these numbers down by sector.
- We are likely to see non-material, non-substantial cyber incidents, Tier 2 and Tier 3 OT cyber incidents, reported to the SEC and in CIRCIA out of an abundance of caution. We are already seeing this with SEC disclosures. A company is unlikely to be fined by reporting too many incidents (with minimal detail). The converse is not true.
- The Tier 2 or Tier 3 decision with limited information is difficult. I’d rely on experienced operations professionals in the applicable sector to make this decision. If there was a safety or protection measure that prevented Tier 1, it would be Tier 3. Short of this or other compelling evidence I’d lean towards Tier 2.
- I excluded healthcare from OT. It’s related, but very different than a factory, power plant, water treatment plant, pipeline, mill, … classic industrial. Governments should have metrics for this sector as well.